New version:
Load From Image URL:
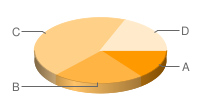
Chart Type: 3D Pie charts
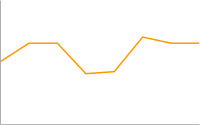
Lines
Bar charts
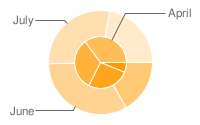
Pie charts
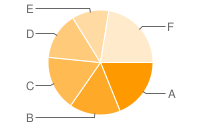
For Pie Charts with labels choose 1000x300 or 800x375 size
Venn diagrams

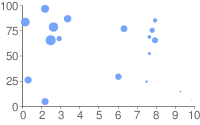
Scatter plots
Radar charts
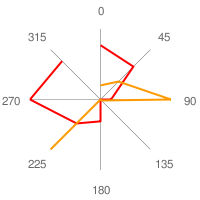
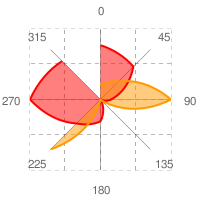
Chart Size: 320x240
Data:
Should be consists only positive numbers,
use minus one (-1) for missing value,
separated by coma, space or semi(,; ),
e.g.: 23, 432, 456, 341
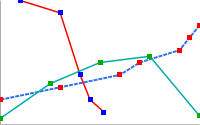
For Lines (pairs):
Input data as x-axis and y-axis coordinates, e.g.: x1,y1, x2,y2, x3,y3
For Lines (pairs):
Input data as x-axis and y-axis coordinates, e.g.: x1,y1, x2,y2, x3,y3
Data Max Value:
To create some space between the highest value and the top of the chart, set Max Value to be larger than
the largest number in the data array
Title:
Use a pipe character (|) to force a line break in title.
Axes:
| Position: | |
|---|---|
| Label: |
|
| Style: |
|
| Font size, alignment and color |
Background:
Gradient Background:
Linear Stripes Background:
Bar Options:
- : Bar Width:
- : Space between bars:
- : Space between groups:
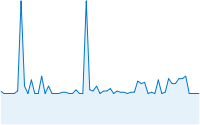
Fill Area:
To fill from the top of the chart to the first line, include a data set which contains only the highest
data value.
To fill from the last line to the bottom of the chart include a data set which contains only the lowest data value.
To fill from the last line to the bottom of the chart include a data set which contains only the lowest data value.
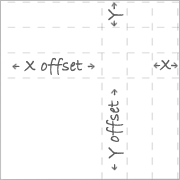
Grid:
- X axis step size
- Y axis step size
- length of line segment
- length of blank segment
- X offset
- Y offset